Imagine deploying an autonomous customer service agent that handles thousands of requests daily. One day, it starts giving polite but completely wrong answers about return policies. Traditional server logs show zero errors. CPU usage is normal. Latency is stable. Yet your customers are furious. This scenario highlights why standard application monitoring fails when dealing with Large Language Model (LLM) Agents that operate in production environments.
The core problem isn't infrastructure-it's semantic drift. Your agent might be running perfectly on the technical side while failing catastrophically at its actual job. This gap between system health and output quality is exactly what LLM Observability aims to close.
Why Traditional Monitoring Fails LLM Agents
If you've monitored web applications before, you know the drill: check HTTP status codes, track response times, watch error rates. These metrics tell you if your server is alive. They don't tell you if your AI is lying.
Monitoring focuses on operational metrics-things like CPU load, memory usage, and request counts. It answers questions like "Is the system up?" and "How fast is it responding?" For traditional software, this is usually enough because inputs are finite and behavior is deterministic. If function A receives input B, it always returns result C.
Observability, however, captures semantic signals. It tracks hallucination rates, toxicity levels, factual accuracy, and prompt quality. It answers harder questions: "Did the agent understand the user's intent?" "Did it use the right tool?" "Was the reasoning chain logical?" According to industry analysis from LangChain, you cannot monitor agents like traditional software because their inputs are infinite, their behavior is non-deterministic, and quality lives in the conversations themselves.
| Aspect | Traditional Monitoring | LLM Observability |
|---|---|---|
| Primary Focus | Infrastructure health | Semantic quality & reasoning |
| Key Metrics | CPU, RAM, latency, error codes | Hallucination rate, token cost, relevance score |
| Data Type | Structured numeric data | Unstructured text + structured traces |
| Failure Detection | Crashes, timeouts | Drift, toxicity, incorrect tool usage |
| Debugging Approach | Stack traces, log lines | Reasoning chains, context windows |
The distinction matters because monitoring creates dangerous blind spots in complex architectures. An agent can have a 99.9% uptime while generating harmful content 30% of the time. You need observability to catch those failures.
Core Components of Agent Observability
Effective observability for production agents requires three interconnected components working together. Think of them as layers of transparency into your agent's mind.
First, you need comprehensive Logging that captures every step in the LLM pipeline. This includes prompts sent to the model, responses received, tools called, arguments passed, and decisions made. Unlike simple application logs, these traces must preserve the sequence and context of multi-step reasoning processes. When an agent decides to call a database API instead of answering directly, that decision point needs recording.
Second, implement automated Output Evaluation using quality metrics. You can't manually review thousands of conversations daily. Instead, establish baselines for helpfulness, relevance, correctness, and safety. Automated evaluators run against each response, flagging outputs that deviate from expected quality standards. Human feedback loops supplement these automated checks for edge cases where nuance matters.
Third, deploy intelligent Anomaly Detection systems. These watch for sudden spikes in toxicity scores, abnormal output lengths, unusual token consumption patterns, or unexpected tool usage frequencies. When anomalies appear, they trigger alerts before small issues become major incidents.
These components work best when instrumented across the entire pipeline-from development experiments through QA testing to live production monitoring. Teams that wait until deployment to add observability miss crucial baseline data needed for meaningful comparison.
Understanding AgentTrace Framework
Recent research has produced frameworks specifically designed for structured agent logging. AgentTrace stands out as the first open standard establishing formal protocols for capturing rich, interpretable traces of autonomous LLM-agent behavior.
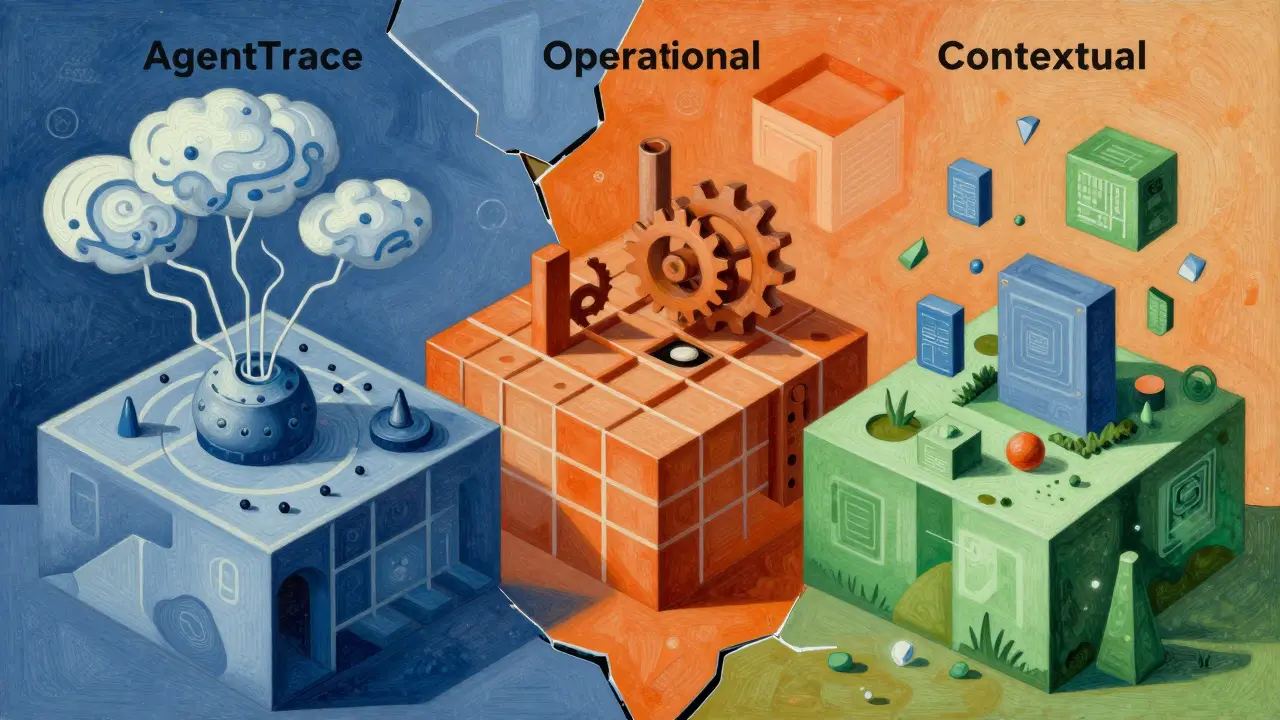
What makes AgentTrace different is its three-surface taxonomy approach. Instead of treating all logs equally, it categorizes information into cognitive, operational, and contextual surfaces:
- Cognitive Surface: Captures the agent's internal deliberations, reasoning steps, hypothesis generation, and confidence levels during decision-making processes.
- Operational Surface: Records control flow, system I/O operations, tool calls, API interactions, and execution timing data.
- Contextual Surface: Preserves environmental factors including user session history, retrieved documents, available tools, and external data store queries.
This schema-based design enables semantically enriched introspection without requiring code modifications. The framework transforms raw runtime events into structured records that reveal not just what happened, but why it happened. AgentTrace integrates with existing telemetry infrastructures like OpenTelemetry to provide scalable, real-time observability.
The result is transparent, accountable, and reproducible agentic systems. When something goes wrong, you can replay the exact cognitive state and environmental conditions that led to the failure. This level of detail elevates observability from an engineering utility to a core enabler of agent safety and governance.
Technical Stack Implementation
Building production-ready observability doesn't require inventing new tools from scratch. Most teams adapt established observability platforms for LLM contexts. Here's how common tools fit together:
OpenTelemetry serves as the backbone for capturing sequences of events through distributed traces. It proves especially crucial in Retrieval-Augmented Generation (RAG) applications where events occur both before and after LLM usage. OpenTelemetry spans multiple services, showing how a user query flows through retrieval systems, language models, and response formatting layers.
Prometheus collects numerical metrics over time. Track request volumes, token usage per endpoint, average latency by model version, and cost accumulation rates. Prometheus excels at aggregating these quantitative signals for dashboard visualization.
Jaeger visualizes trace data graphically. When debugging complex agent behaviors, seeing the full execution path helps identify bottlenecks and unexpected branching logic. Jaeger displays timing relationships between sequential tool calls and LLM invocations.
Grafana presents unified dashboards combining metrics, traces, and custom LLM-specific visualizations. Create panels showing hallucination rates alongside cost trends, or correlate user satisfaction scores with specific model versions.
For foundational logging, standard Python logging with JSON formatters provides structured data collection suitable for downstream analysis. The key is ensuring every log entry includes correlation IDs that link related events across the entire agent lifecycle.
Production Platform Capabilities
Dedicated LLM observability platforms extend basic tooling with features specifically designed for agent workloads. What should you look for when evaluating solutions?
Quality Monitoring tracks how often agents produce helpful, relevant, and correct responses over time. Detect quality degradation caused by model updates, training data drift, or emerging user interaction patterns. Set thresholds for acceptable performance drops and receive notifications when breaches occur.
Topic Tagging automatically classifies production queries into categories for product analytics. Understanding what users attempt to accomplish reveals gaps in agent capabilities and opportunities for improvement. Are most queries about billing? Technical support? Account management?
Custom Dashboards designed for domain-specific insights enable tracking success metrics like task completion rates or user satisfaction scores across different workflows. Compare performance between model versions, monitor cost and latency by feature area, and identify which agent configurations deliver best results.
Flexible Alerting via webhooks or PagerDuty integration triggers when metrics cross established thresholds. Configure separate alert channels for critical failures versus informational warnings to avoid notification fatigue.
Drill-Down Capabilities allow moving from aggregate metrics into specific traces for detailed investigation. Click through from a spike in error rates to individual conversation transcripts showing exactly where reasoning broke down.

Continuous Improvement Workflow
Observability only delivers value when connected to action. The most effective teams integrate production monitoring directly into their development cycle, creating continuous improvement loops.
Here's how the workflow operates in practice:
- Capture Production Traces: Real-world usage reveals failure cases and edge cases that testing missed. Every problematic interaction becomes a learning opportunity.
- Review Annotation Queues: Teams examine flagged examples, labeling them with appropriate tags indicating failure types, severity levels, and suggested fixes.
- Incorporate Into Datasets: Annotated examples join test datasets used for evaluation. These ground-truth samples help measure whether proposed changes actually improve behavior.
- Run Experiments: Test modifications against historical data and current traffic samples. Does the new prompt template reduce hallucinations? Does additional context window allocation improve accuracy?
- Validate Online: Deploy fixes incrementally while monitoring impact. Compare new version performance against baselines before full rollout.
- Repeat Continuously: Production data feeds back into the cycle, identifying new improvement opportunities as usage patterns evolve.
LangSmith, built by LangChain based on patterns observed working with deployment teams, exemplifies this integrated approach. Rather than treating observability as separate from development, successful organizations build evaluation baselines that carry through to production governance without manual handoffs between lifecycle stages.
Multi-Agent System Complexity
Single-agent deployments already demand sophisticated observability. Multi-agent systems multiply complexity exponentially. When multiple LLMs coordinate tasks, delegate sub-problems, and share context, visibility requirements expand significantly.
Multi-agent architectures need enhanced observability tracking several dimensions simultaneously:
- Trajectory-level tracing for non-deterministic reasoning across coordinated agents
- Tool orchestration patterns revealing cascading error propagation
- Multi-turn context management spanning sessions and agent boundaries
- Inter-agent communication patterns showing delegation effectiveness
- Autonomous planning validation confirming strategic decisions align with goals
AWS Prescriptive Guidance emphasizes that observability becomes essential rather than optional for agentic systems because autonomous agents make independent decisions creating variable execution paths. Databricks research identifies tool-related failures as the most common category of production agent failures, requiring structured validation of tool calls and arguments throughout coordination chains.
Without purpose-built LLM-specific observability platforms, multi-agent systems remain largely opaque black boxes. Decisions emerge from complex interactions that traditional monitoring simply cannot capture or explain.
Getting Started With Implementation
You don't need perfect observability on day one. Start with fundamentals and expand coverage as your agent matures. Here's a practical progression path:
Phase 1: Basic Instrumentation. Add structured JSON logging capturing prompts, responses, timestamps, and correlation IDs. Implement standard metric collection for request volume, latency, and token usage. Connect logs to centralized storage for searchability.
Phase 2: Quality Baselines. Define what good looks like for your specific use case. Establish automated evaluation criteria for relevance, correctness, and safety. Create initial dashboards showing these quality metrics alongside operational data.
Phase 3: Trace Integration. Adopt OpenTelemetry or similar tracing framework. Map complete execution paths from user input through agent reasoning to final output. Enable drill-down capabilities connecting metrics to specific conversation instances.
Phase 4: Advanced Analytics. Implement anomaly detection algorithms watching for unusual patterns. Build topic tagging systems categorizing user intents. Develop custom alerting rules tied to business outcomes rather than just technical thresholds.
Phase 5: Continuous Loop. Connect production observations back to development workflows. Automate dataset creation from annotated failures. Run regular experiments measuring improvement hypotheses. Close the loop between observation and action.
The teams achieving best results instrument their autonomous agents from the first prototype stage. Building evaluation baselines early prevents costly retrofits later and establishes cultural habits around quality measurement.
What is the difference between monitoring and observability for LLM agents?
Monitoring tracks operational metrics like server health, latency, and error rates. Observability captures semantic signals including hallucination rates, reasoning quality, and output relevance. Monitoring tells you if your system is running; observability tells you if your agent is performing correctly. For LLM agents, observability is essential because technical health doesn't guarantee output quality.
Do I need specialized tools for LLM observability?
While you can adapt existing tools like OpenTelemetry, Prometheus, and Grafana, dedicated LLM observability platforms provide features specifically designed for agent workloads. These include semantic evaluation metrics, trace visualization for reasoning chains, topic classification, and quality trend analysis. Specialized tools save development time and provide deeper insights into agent behavior patterns.
How does AgentTrace improve agent logging?
AgentTrace introduces a structured schema organizing logs into cognitive, operational, and contextual surfaces. This taxonomy captures not just system events but also reasoning processes, decision rationales, and environmental factors. The framework enables semantically enriched introspection without code modifications, making agent behavior transparent, accountable, and reproducible for debugging and governance purposes.
What metrics should I track for production LLM agents?
Track both operational metrics (request volume, latency, token usage, costs) and semantic metrics (hallucination rate, relevance scores, toxicity levels, factual accuracy). Monitor quality trends over time to detect degradation. Watch for anomalies in output length distributions, tool usage patterns, and user satisfaction indicators. Combine quantitative measurements with qualitative trace analysis for complete visibility.
When should I start implementing observability?
Start instrumenting agents from the first prototype stage. Early implementation builds evaluation baselines that carry through to production governance. Waiting until deployment means missing baseline data needed for meaningful comparison. Teams that integrate observability early develop better quality habits and avoid costly retrofits when scaling to production workloads.
How do multi-agent systems change observability requirements?
Multi-agent systems require enhanced observability tracking inter-agent communication, coordinated reasoning trajectories, cascading error detection, and shared context management across agent boundaries. Traditional monitoring cannot capture these complex interactions. Purpose-built LLM observability platforms provide trajectory-level tracing and coordination pattern analysis essential for understanding multi-agent behavior and diagnosing failures in coordinated workflows.
Can I use OpenTelemetry for LLM observability?
Yes, OpenTelemetry serves as an excellent foundation for capturing distributed traces across LLM pipelines. It handles event sequencing, span relationships, and cross-service correlation effectively. However, you'll need complementary tools or custom extensions to capture semantic quality signals like hallucination detection and reasoning validation. OpenTelemetry works best when combined with specialized LLM evaluation frameworks and semantic analysis capabilities.
What is the continuous improvement loop for LLM agents?
The loop connects production observability to development: capture real-world failure traces, annotate and label problematic examples, incorporate them into test datasets, experiment with fixes, validate improvements online, and repeat. This cycle transforms production data into actionable enhancements. Successful teams automate parts of this workflow, reducing manual effort while maintaining rigorous quality standards throughout the agent lifecycle.